11 сентября 2001, стр. 60
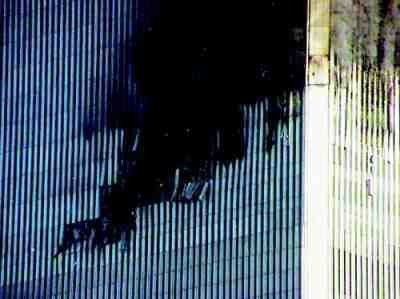
Figure 2-24 Southeast corner of WTC 2 shortly after aircraft impact.
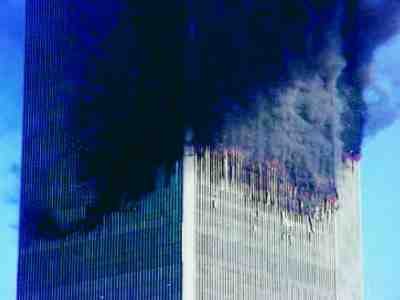
Figure 2-26 Impact damage to the south and east faces of WTC 2.
were fractured by the impact. Photographic evidence suggests that from 27 to 32 columns along the south building face were destroyed over a five-story range. Partial collapse of floors in this zone appears to have occurred over a horizontal length of approximately 70 feet, while floors in other portions of the building appeared to remain intact. It is probable that the columns in the southeast corner of the core also experienced some damage because they would have been in the direct travel path of the fuselage and port engine (Figure 2-25).
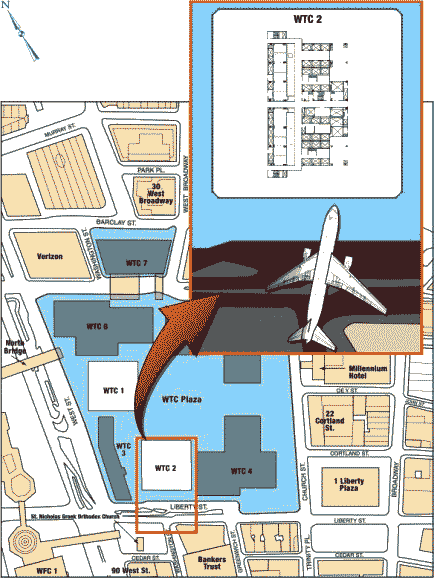
Figure 2-25 Approximate zone of impact of aircraft on the south face of WTC 2.
It is known that debris from the aircraft traveled completely through the structure. For example, a landing gear from the aircraft that impacted WTC 2 was found to have crashed through the roof of a building located six blocks to the north, and one of the jet engines was found at the corner of Murray and Church Streets. The extent to which debris scattered throughout the impact floors is also evidenced by photographs of the fireballs that occurred as the aircraft struck the building (Figure 2-28). Figure 2-29 shows a portion of the fuselage of the aircraft, lying on the roof of WTC 5.
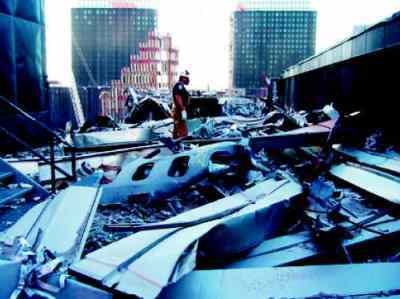
Figure 2-29 A portion of the fuselage of United Airlines Flight 175 on the roof of WTC 5.
As described for WTC 1, this debris doubtless caused some level of damage to the structure across the floor plates, including interior framing; core columns at the southeast corner of the core; framing at the north, east, and west walls; and the floor plates themselves. Figure 2-30, showing the eastern side of the north face of the WTC 2 partially hidden behind WTC 1, suggests that damage to the exterior walls was not severe except at the zone of impact. The exact extent of this damage will likely never be known with certainty. It is evident that the structure retained sufficient integrity and strength to remain globally stable for a period of approximately 56 minutes.
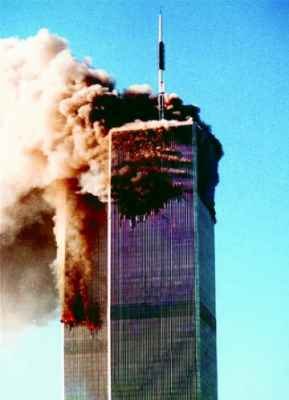
Figure 2-30 North face of WTC 2 opposite the zone of impact on the south face, behind WTC 1.
There are some important differences between the impact of the aircraft into WTC 2 and the impact into WTC 1. First, United Airlines Flight 175 was flying much faster, with an estimated speed of 590 mph, while American Airlines Flight 11 was flying at approximately 470 mph. The additional speed would have

Figure 2-28 Conflagration and debris exiting the north wall of WTC 2, behind WTC 1.
given the aircraft a greater ability to destroy portions of the structure. The zone of aircraft impact was skewed toward the southeast corner of WTC 2, while the zone of impact on WTC 1 was approximately centered on the building's north face. The orientation of the core in WTC 2 was such that the aircraft debris would only have to travel 35 feet across the floor before it began to impact and damage elements of the core structure. Finally, the zone of impact in WTC 2 was nearly 20 stories lower than that in WTC 1, so columns in this area were carrying substantially larger loads. It is possible, therefore, that structural damage to WTC 2 was more severe than that to WTC 1, partly explaining why WTC 2 collapsed more quickly than WTC 1.
2.2.2.2 Preliminary Structural Analysis
An approximate linear structural analysis of WTC-2 was performed using SAP-2000 software (CSI 2000) to provide an understanding of the likely stress state in the building following the aircraft impact. The upper 55 stories of the building's exterior-wall frame were explicitly modeled using beam and column elements. This encompassed the entire structure above the zone of impact and about 20 stories below. The lower 55 stories of the exterior were modeled as a «boundary condition» consisting of a perimeter super-beam that was 52 inches deep and about 50 inches wide, supported on a series of springs. A base spring was provided at each column location to represent the axial stiffness of the columns from the 55th floor down to grade. The outrigger trusses at the top of the building were explicitly modeled, using truss-type elements. The interior core columns were modeled as spring elements.
An initial analysis of the building was conducted to simulate the pre-impact condition. In addition to the weight of the floor itself (approximately 54 psf at the building edges and 58 psf at the building sides), a uniform floor loading of 12 psf was assumed for partitions and an additional 20 psf was conservatively assumed to represent furnishings and contents. At the 80th floor level, exterior columns were found to be approximately uniformly loaded with an average utilization ratio (ratio of actual applied stress to ultimate stress) of under 20 percent. This low utilization ratio is due in part to the unusually close spacing of the columns in this building, which resulted in a very small tributary area for each column. It reflects the fact that wind and deflection considerations were dominant factors in the design. Core columns were more heavily loaded with average calculated utilization ratios of 60 percent, which would be anticipated for these columns, which were designed to resist only gravity loads.
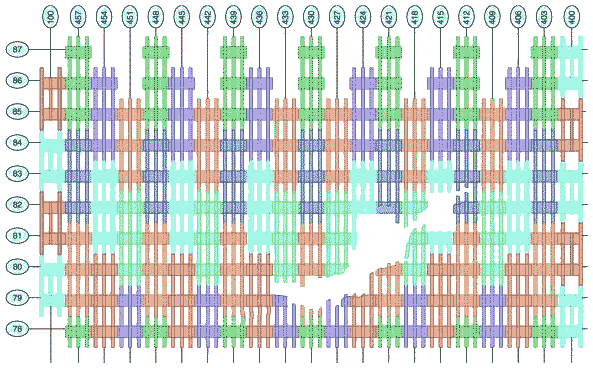
General notes:
(1) Column damage captured from photographs and enchanced video.
(2) Damage to column lines 413-418 at levels 81 and 82 is estimated.
(3) There is not sufficient information to detail damage to column lines 408-411 at levels 83-84.
Figure 2-27 Impact damage to exterior columns on thr south face of WTC 2.
A second analysis was conducted to estimate the demands on columns immediately following aircraft impact and before fire effects occurred. Exterior columns were removed from the model to match the damage pattern illustrated in Figure 2-27. Although some core columns were probably damaged by the aircraft impact, the exact extent of this damage is not known and therefore was not considered in the model. As a result, this analysis is thought to underestimate the true stress state in the columns immediately after impact. The analysis indicates that most of the loads initially carried by the damaged exterior columns were transferred by Vierendeel truss action to the remaining exterior columns immediately adjacent to the impact area. If the floors at this level are assumed to remain intact and capable of providing lateral support to the columns, this raised the utilization ratio for the most heavily loaded column immediately adjacent to the damage area to approximately a value of 1.0. At a value of 1.0, columns would lose stiffness and shift load to adjacent columns. Based on this analysis, it appears that the structure had significant remaining margin against collapse. However, this analysis does not consider damage to the building core, which was likely significant. Columns located further from the damage area are less severely impacted, and columns located only 20 feet away from the damaged area experience almost no increase in demand at all. These data are plotted in Figure 2-31.